ProDelphi64 26.5

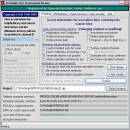
ProDelphi x64 is a tool to measure the runtime of programs written in Delphi Object Pascal. First successful industrial usage of ProDelphi was in February 1998. Since then ProDelphi has been permanently improved, also a lot of customer suggestions were integrated. ...

Author Helmuth J.H. Adolph
License Freeware
Price FREE
Released 2012-05-21
Downloads 179
Filesize 4.10 MB
Requirements
Installation Instal And Uninstall
Keywords x64 source code profiler, x64 measure runtime, x64 Delphi runtime, x64 runtime, x64 Delphi, x64 measure
Users' rating
(13 rating)
ProDelphi64OtherWindows Vista x64, Windows 7 x64
ProDelphi64 code profiling - Download Notice

Using ProDelphi64 Free Download crack, warez, password, serial numbers, torrent, keygen, registration codes, key generators is illegal and your business could subject you to lawsuits and leave your operating systems without patches. We do not host any torrent files or links of ProDelphi64 on rapidshare.com, depositfiles.com, megaupload.com etc. All ProDelphi64 download links are direct ProDelphi64 full download from publisher site or their selected mirrors.
Avoid: code profiling oem software, old version, warez, serial, torrent, ProDelphi64 keygen, crack.
Consider: ProDelphi64 full version, code profiling full download, premium download, licensed copy.

ProDelphi64 code profiling - The Latest User Reviews

Most popular Other downloads

CUDA for Mac

12.5.0 download

... HW debugging support in cuda-gdb o Fermi HW profiling support for CUDA C and OpenCL in Visual ... for Visual Studio, with integrated GPU debugging and profiling tools (was code-named "Nexus"). Please see www.nvidia.com/nsight for ...

CUDA

12.5.0 download

... HW debugging support in cuda-gdb o Fermi HW profiling support for CUDA C and OpenCL in Visual ... for Visual Studio, with integrated GPU debugging and profiling tools (was code-named "Nexus"). Please see www.nvidia.com/nsight for ...

CUDA for Linux

12.5.0 download

... HW debugging support in cuda-gdb o Fermi HW profiling support for CUDA C and OpenCL in Visual ... for Visual Studio, with integrated GPU debugging and profiling tools (was code-named "Nexus"). Please see www.nvidia.com/nsight for ...

Android NDK

r27d LTS download

... to optimize their Android applications by leveraging native code. This toolkit is particularly beneficial for performance-critical applications ... The inclusion of powerful debugging tools and performance profiling utilities further aids in fine-tuning applications to achieve ...

Windows Phone SDK

8.0 download

... you can use your existing programming skills and code to build managed or native code apps. In addition, the SDK includes multiple emulators and additional tools for profiling and testing your Windows Phone app under real-world ...

Android SDK for Mac and Linux

Release 35.0.1 download

... device emulator, tools for debugging, memory and performance profiling, and a plugin for the Eclipse IDE ...

Pismo Trace Monitor

23U download

... used during development to allow realtime monitoring and profiling. It can also be used in the field ... written from any executable, DLL, or driver. Minor code impact, include one header file and change printf ...

Pismo Trace Monitor SDK

23U download

... used during development to allow realtime monitoring and profiling. It can also be used in the field ... written from any executable, DLL, or driver. Minor code impact, include one header file and change printf ...

Pismo Trace Monitor for Mac OS X

23U download

... used during development to allow realtime monitoring and profiling. It can also be used in the field ... written from any executable, DLL, or driver. Minor code impact, include one header file and change printf ...

ProDelphi64

26.5 download

... or multiple nested functions are measured precisely. After profiling with ProDelphi you know where the bottle neck ... The user friendly human interface makes the profiling process fast and easy, the sorting viewer enables ...