Simplexety 8.0.0.1

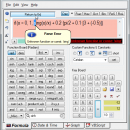
... With it, you can evaluate mathematical formulas, draw graphs and program with very simple VBScript. Simplexety is a sophisticated calculation application. It supports direct access to the Microsoft Visual Basic Scripting engine. The program supports symbolic derivation and a host of other numerical functions. Simplexety is object orientated programmed in VC++. ...

Author Dipl.-Phys.-Ing. Ralf Wirtz
License Freeware
Price FREE
Released 2017-01-28
Downloads 830
Filesize 14.98 MB
Requirements Windows XP, Windows 2003, Vista, Windows 7
Installation Install and Uninstall
Keywords Parser, Calculator, VBScript, Formula Editor
Users' rating
(13 rating)
SimplexetyMathematicsWin2000, Windows XP, Windows 7 x32, Windows 7 x64, Windows 8, Windows 10, WinServer, WinOther, Windows Vista, Windows Vista x64
Simplexety graphs - Download Notice

Using Simplexety Free Download crack, warez, password, serial numbers, torrent, keygen, registration codes, key generators is illegal and your business could subject you to lawsuits and leave your operating systems without patches. We do not host any torrent files or links of Simplexety on rapidshare.com, depositfiles.com, megaupload.com etc. All Simplexety download links are direct Simplexety full download from publisher site or their selected mirrors.
Avoid: graphs oem software, old version, warez, serial, torrent, Simplexety keygen, crack.
Consider: Simplexety full version, graphs full download, premium download, licensed copy.

Simplexety graphs - The Latest User Reviews

Most popular Mathematics downloads

Graphing Calculator 3D

5.1 download

Plot high quality graphs of mathematical equations and data with this easy-to-use ... tools to make a perfection visualization of your graphs. Features include: - Plot 2D & 3D functions ... - Plot 3D scatter points - Plot contour graphs - Generate tables of values - Cartesian coordinates ...

Rt-Plot

2.8.10.83 download

... enter and calculate tabular data. View the changing graphs, including linear and non linear regression, interpolation, differentiation ... data points in data table, unlimited number of graphs, unlimited number of series in graph, unlimited number ...

5 award

Group Explorer for Linux

2.2.0.0 download

... * Displays Cayley diagrams, multiplication tables, cycle graphs, and objects with symmetry * Many common group-theoretic ... them easy to view and edit. Cycle Graphs Cycle graphs show all the orbits in ...

5 award

Graph Paper Maker Software

7.0 download

This software offers a solution to users who want to make graph paper for graphing equations. There are options to select the number of lines, scale (in inches or centimeters), thickness ...

CalculationLaboratory

1.4.22.1570 download

CalculationLaboratory - mathematical program that can handle scripts (your own programming language), also can process scripts extreme numbers (both decimal binary(256-bit number) and a 16-bit format). There is support for multi-threading ...

Graphing Calculator 3D for Mac

5.1 download

Plot high quality graphs of mathematical equations and data with this easy-to-use ... tools to make a perfection visualization of your graphs. Features include: - Plot 2D & 3D functions ... - Plot 3D scatter points - Plot contour graphs - Generate tables of values - Cartesian coordinates ...

PlotDigitizer

2.1.1 download

... Digitizer, Users can quickly extract numerical data from graphs, plots, charts, and images. It supports several graph types, besides standard XY graphs. The other graphs categories XY, horizontal bar, vertical bar, histogram, polar ...

Nonlinear analysis - DataFitting

1.7.73 download

... You can preview your graph and output publication-quality graphs in several different configurations. A residual graph as well as parameter output is generated for the selected fitted equation. Data, statistical ...

Equation graph plotter - EqPlot

1.3.67 download

EqPlot plots 2D graphs from complex equations. The application comprises algebraic, trigonometric, hyperbolic and transcendental functions. EqPlot can be used to verify the results of nonlinear regression analysis program. Graphically ...

Statmaster

2.30 download

... of histograms and XY plots, up to 64 graphs per page. The way in which the data ... a runtime user interface to adjust how the graphs are presented, and is therefore best fit for ...