5dchart Add-In for MS Excel 3.2.0.1

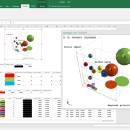
Create stunning 3D bubble charts in Excel with 5dchart Add-In! 5dchart Add-In for ... for multi-dimensional data visualization. It allows you to display a 3D bubble chart with two additional parameters: 3D coordinates of each ... scatter plot too. Also you can compute and display a 3D regression plane easily! ...

Author Roman Demyanets
License Free To Try
Price $99.90
Released 2021-06-06
Downloads 222
Filesize 6.42 MB
Requirements Windows Vista, 7, 8/8.1, 10; Excel 2010 or later (Office 2010, 2013, 2016 and 2019, Office 365)
Installation Install and Uninstall
Keywords bubble chart, 3D bubble chart, scatter plot, 3D scatter plot, chart generator, charting tool, chart, bubble, Excel, Add-In, regression analysis
Users' rating
(8 rating)
5dchart Add-In for MS ExcelOffice Suites & ToolsWin2000, Windows XP, Windows 7 x32, Windows 7 x64, Windows 8, Windows 10, WinServer, WinOther, Windows Vista, Windows Vista x64
5dchart Add-In for MS Excel chart display - Download Notice

Using 5dchart Add-In for MS Excel Free Download crack, warez, password, serial numbers, torrent, keygen, registration codes, key generators is illegal and your business could subject you to lawsuits and leave your operating systems without patches. We do not host any torrent files or links of 5dchart Add-In for MS Excel on rapidshare.com, depositfiles.com, megaupload.com etc. All 5dchart Add-In for MS Excel download links are direct 5dchart Add-In for MS Excel full download from publisher site or their selected mirrors.
Avoid: chart display oem software, old version, warez, serial, torrent, 5dchart Add-In for MS Excel keygen, crack.
Consider: 5dchart Add-In for MS Excel full version, chart display full download, premium download, licensed copy.

5dchart Add-In for MS Excel chart display - The Latest User Reviews

Most popular Office Suites & Tools downloads

OpenProj

1.4 download

... advanced scheduling engine with Project-ON-Demand and provides Gantt Charts, Network Diagrams (PERT Charts), WBS and RBS charts, Earned Value costing and more. There is literally ...

Microsoft Visio Viewer

2013 download

... installed version of Internet Explorer launches and it displays the chart. The benefit of using IE for opening files ... also offers users the possibility to enlarge the chart to allow them to carefully analyze each detail ...

PERT Chart EXPERT

5.1.0025 download

PERT Chart EXPERT is an application used to create PERT charts (also known as Network Charts, Precedence Diagrams and Logic Diagrams). A PERT chart displays the tasks in a project along with ...

SSuite Axcel Professional Spreadsheet

2.4.6.1 download

... and produce subtotals and statistical analyses. Use the chart wizard to select from eight or more categories of 2-D and 3-D charts including line, area, column, pie, XY, stock and ... Professional lets you present spreadsheet data in dynamic charts that update automatically when the data changes. What's ...

myWordCount

3.07 download

... RTF/TXT file, websites, pasted text, or Scrivener project. Display all occurences of words, 3/4/5-word phrases, or 1/2/3-word ... same phrase to start multiple sentences. You can display a bar-chart histogram representing every sentence in your ...

Portable es-Builder

2.2.16 download

... to build it and use it. ยท Views, Charts, Reports - Build-in Views, Charts and Reports bring the data to another level. ... Shortcut Homepage - Drag the items (tables, views, charts and reports) into the homepage for fast access. ...

OpenProj for Mac OS X

1.4 download

... advanced scheduling engine with Project-ON-Demand and provides Gantt Charts, Network Diagrams (PERT Charts), WBS and RBS charts, Earned Value costing and more. There is literally ...

OpenProj for Linux

1.4 download

... advanced scheduling engine with Project-ON-Demand and provides Gantt Charts, Network Diagrams (PERT Charts), WBS and RBS charts, Earned Value costing and more. There is literally ...

SSuite QT Calc Express

2.4.2.1 download

... makes entering complex formulas a breeze. Use the chart wizard to select from eight or more categories of 2-D and 3-D charts including line, area, column, pie, XY, stock and ... Calc lets you present spreadsheet data in dynamic charts that update automatically when the data changes. This ...

BSC Designer Android

1.2 download

... indicators and categories, such as value and weight Display Balanced Scorecard tree Display charts Share scorecards (Dropbox service is recommended) ...