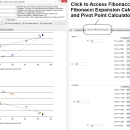
Chart Patterns Tutorial 3.6
Chart Patterns Tutorial Application uses the computer simulation to visualize the chart patterns that are derived from Fractal Wave. This tool can visualize the Fibonacci Price Pattern, Harmonic Pattern, Elliott Wave and X3 Chart Pattern. It is a great tool to visualize the profitable chart patterns for the self-education. In addition, this tool provides ...
| Author | Young Ho Seo |
| License | Freeware |
| Price | FREE |
| Released | 2021-04-17 |
| Downloads | 215 |
| Filesize | 891 kB |
| Requirements | Dot Net Framework 4.5 or higher on Windows |
| Installation | Install and Uninstall |
| Keywords | Chart Patterns, Fibonacci Analysis, Harmonic Pattern, Elliott Wave, X3 Chart Pattern, Pivot Point |
| Users' rating (21 rating) |
Using Chart Patterns Tutorial Free Download crack, warez, password, serial numbers, torrent, keygen, registration codes,
key generators is illegal and your business could subject you to lawsuits and leave your operating systems without patches.
We do not host any torrent files or links of Chart Patterns Tutorial on rapidshare.com, depositfiles.com, megaupload.com etc.
All Chart Patterns Tutorial download links are direct Chart Patterns Tutorial full download from publisher site or their selected mirrors.
Avoid: chart pattern oem software, old version, warez, serial, torrent, Chart Patterns Tutorial keygen, crack.
Consider: Chart Patterns Tutorial full version, chart pattern full download, premium download, licensed copy.


