WinTrend 3.9

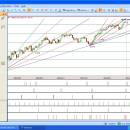
Wintrend.com is providing high quality Real-time and Historical Charting and Technical Analysis for the financial markets. Supports all types of markets: stocks, futures, indexes, spreds, currencies and options. Wintrend has a large set of indicators, studies and drawing tools. You can create your own custom indicators and systems using the built-in scripting language or create custom studies using free Microsoft .net competitive compiles. ...

Author Wintrend.com
License Freeware
Price FREE
Released 2009-09-14
Downloads 763
Filesize 4.31 MB
Requirements .NET 3.0
Installation Install and Uninstall
Keywords Jenkins, Gann, Elliot, Hurst, Fibonacci, astro cycles, cycles planets, trading markets, real time trading, real-time quotes, law of vibration, trading cycles, market geometry, trading analysis, historical data, intraday charts, end-of-day data
Users' rating
(15 rating)
WinTrendInvestment ToolsWindows XP, Windows Vista, Windows Vista x64, Windows Vi
WinTrend chart s - Download Notice

Using WinTrend Free Download crack, warez, password, serial numbers, torrent, keygen, registration codes, key generators is illegal and your business could subject you to lawsuits and leave your operating systems without patches. We do not host any torrent files or links of WinTrend on rapidshare.com, depositfiles.com, megaupload.com etc. All WinTrend download links are direct WinTrend full download from publisher site or their selected mirrors.
Avoid: chart s oem software, old version, warez, serial, torrent, WinTrend keygen, crack.
Consider: WinTrend full version, chart s full download, premium download, licensed copy.

WinTrend chart s - The Latest User Reviews

Most popular Investment Tools downloads

Stock Volatility Calculator

1 download

... prices are plotted along side the stock price chart. The user can freely change the stock used by entering the ticker symbol into the appropriate field and perform a fresh ...

Stock Predictor

1.1.361 download

Stock Predictor is an advanced stock charting and investment strategies backtesting software for financial market ... indicators for a single security on the same chart, maintains selected lists of stocks and indices and ...

Stockalyze

2024.2.8.84 download

Create Technical chart of EOD (End of day) and intraday stock ... indicators by simple drag-drop operation. Point and Figure chart: Create Point and Figure chart with adaptive box sizes. Fibonacci retracements, and Linear ...

Stock Predictor

1.1.361 download

Stock Predictor is an advanced stock charting and investment strategies backtesting software for financial market ... indicators for a single security on the same chart, maintains selected lists of stocks and indices and ...

Stock Spy - RSS Stock News Charts

1.90 download

Have you ever seen a stock chart and wondered what made the stock shoot up ... rock? Stock Spy is unlike any other stock chart because it helps explain what you're seeing. It ...

TraderStar

1.1.0.2 download

TraderStar is a Powerful professional analysis Software of a new Generation with significant advantages over similar programs. TraderStar is designed for a broad range of users, from stock exchange professionals to ...

TraderCode Technical Indicators

5.0 download

... be measured and analyzed quickly and easily. Point-and-Figure Charting Expert Point-and-Figure charting is an analysis technique that has been around ... and investors. This technical analysis technique uses a chart with "X"s and "O"s for predicting financial asset ...

Stock Spy Mac OS X- RSS Stock News Charts

1.90 download

Have you ever seen a stock chart and wondered what made the stock shoot up ... rock? Stock Spy is unlike any other stock chart because it helps explain what you're seeing. It ...

StockwareLive

2.1 download

... specifically for intraday traders. It displays intraday price charts side by side in full screen mode, that ... your choice and creates buy, sell signals on chart. The intraday trader can quickly view the price ...

Chart Patterns Tutorial

3.6 download

Chart Patterns Tutorial Application uses the computer simulation approach to visualize the chart patterns that are derived from Fractal Wave. This ... Price Pattern, Harmonic Pattern, Elliott Wave and X3 Chart Pattern. These patterns are the powerful chart patterns ...