HardMon 2.0

HardMon, developed by Ari Sohandri Putra, is a robust monitoring tool designed for system administrators and developers alike. It provides real-time insights into hardware performance, enabling users to track metrics such as CPU usage, memory consumption, and disk activity with ease. The intuitive interface and customizable dashboards make it accessible for both novices and experts. With its lightweight footprint and efficient resource management, HardMon stands out as an essential tool for main ... ...

Author Ari Sohandri Putra
License Freeware
Price FREE
Released 2025-06-30
Downloads 10
Filesize 1.70 MB
Requirements
Installation
Keywords HardMon, download HardMon, HardMon free download, Hardware Monitoring, System Monitoring, Real-Time Monitoring, monitoring, hardware, system, component
Users' rating
(2 rating)
HardMonSystem MaintenanceWindows 11, Windows 10 32/64 bit, Windows 8 32/64 bit, Windows 7 32/64 bit, Windows Vista
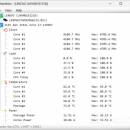
HardMon data graphs - Download Notice

Using HardMon Free Download crack, warez, password, serial numbers, torrent, keygen, registration codes, key generators is illegal and your business could subject you to lawsuits and leave your operating systems without patches. We do not host any torrent files or links of HardMon on rapidshare.com, depositfiles.com, megaupload.com etc. All HardMon download links are direct HardMon full download from publisher site or their selected mirrors.
Avoid: data graphs oem software, old version, warez, serial, torrent, HardMon keygen, crack.
Consider: HardMon full version, data graphs full download, premium download, licensed copy.

HardMon data graphs - The Latest User Reviews

Most popular System Maintenance downloads

Memory Optimizer 2

2.1.0 download

... & shows you what's eating it in colorful graphs. Just click 'Recover' to instantly free up RAM. Not only will Memory Optimizer remove cached data, but it will also optimize your reserved and ...

SuperRam

7.10.21.2024 download

... the system from becoming bogged down by unnecessary data. This proactive memory management can result in noticeable ... novice and advanced users. The software provides real-time graphs and statistics that allow users to monitor memory ...

Argus Monitor

7.2.3 Build 3030 download

... is its ability to monitor and display real-time data on critical system components such as CPU, GPU, ... organized view of all monitored parameters, with customizable graphs and charts that can be tailored to individual ...

OPC Scada Viewer

2.0.0 Build 1207 download

... sector who need to visualize and monitor real-time data from OPC servers. This software stands out for its ability to transform complex data streams into easily interpretable visual formats, making it ...

nTop

0.3.20 download

... a single, cohesive view. The use of color-coded graphs and charts enhances readability and helps users identify ... Traffic:** Monitoring of network interfaces, bandwidth usage, and data transfer rates. These comprehensive monitoring capabilities make ...

MiTeC Task Manager DeLuxe

4.9.0.0 download

... and sections, allowing users to quickly find the data they need without feeling overwhelmed. **Conclusion:** Task Manager DeLuxe by MiTec is a powerful and versatile tool that goes ...

bottom

0.10.2 download

... activity, and network traffic. The tool presents this data in a visually appealing manner, using graphs and charts that are easy to interpret at ...

appsizerGUI

2.2.2 download

... through the process of importing, analyzing, and interpreting data. **Functionality and Features** AppSizerGUI offers a ... It also includes visualization tools that transform raw data into easily digestible graphs and charts, facilitating a ...

Tockler

4.0.18 download

... into their daily routines. By automatically capturing activity data, Tockler eliminates the need for manual input, thereby ... Tockler's standout features is its ability to visualize data through clear and informative graphs. These visualizations allow ...

Portable Folder Size

5.9.0.1 download

... software's intuitive interface is a standout feature, presenting data in a clear, organized manner through pie charts, bar graphs, and detailed lists. This visual representation allows users to grasp complex data at a glance, making it easier to make ...