GRAFster 7.3.5.4

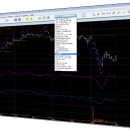
GRAFster6 is an easy to use charting and analysis application. Use it to plot equities, indices, futures, mutual funds, currencies or any time series in a compatible data format. It offers most of the usual technical analysis indicators without being redundant, a few uncommon ones, and some for which you will jave to pay plenty. ...

Author theGRAFster
License Trialware
Price $20.00
Released 2022-10-07
Downloads 448
Filesize 3.60 MB
Requirements
Installation Instal And Uninstall
Keywords create graph, technical analysis, chart application, graph, analyze, technical
Users' rating
(14 rating)
GRAFsterOffice Suites & ToolsWindows XP, Windows Vista, Windows Vista x64, Windows 7, Windows 7 x64, Windows 8, Windows 8 x64, Windows 10, Windows 10 x64, Windows 11
GRAFster line charts - Download Notice

Using GRAFster Free Download crack, warez, password, serial numbers, torrent, keygen, registration codes, key generators is illegal and your business could subject you to lawsuits and leave your operating systems without patches. We do not host any torrent files or links of GRAFster on rapidshare.com, depositfiles.com, megaupload.com etc. All GRAFster download links are direct GRAFster full download from publisher site or their selected mirrors.
Avoid: line charts oem software, old version, warez, serial, torrent, GRAFster keygen, crack.
Consider: GRAFster full version, line charts full download, premium download, licensed copy.

GRAFster line charts - The Latest User Reviews

Most popular Office Suites & Tools downloads

Microsoft Power BI Desktop

2.145.1602.0 download

... offers a rich library of visualizations, including bar charts, line graphs, scatter plots, maps, and more. These visualizations ...

LibreOffice

25.2.4.3 Latest download

... then use it to present your final output. Charts and analysis tools help bring transparency to your ... 2D and 3D graphics from 13 categories, including line, area, bar, pie, X-Y, and net – with ...

SSuite Accel Spreadsheet

8.44.2.2 download

... eight or more categories of 2-D and 3-D charts including line, area, column, pie, XY, stock and with dozens ... Accel lets you present spreadsheet data in dynamic charts that update automatically when the data changes. What's ...

SSuite Axcel Professional Spreadsheet

2.4.6.1 download

... eight or more categories of 2-D and 3-D charts including line, area, column, pie, XY, stock and with dozens ... Professional lets you present spreadsheet data in dynamic charts that update automatically when the data changes. What's ...

EMF to Vector Converter Command Line Developer License

2.0 download

... integrated COM object (or DLL Library, or Command Line), enabling developers to access the converter via any ... the COM object (or DLL Library, or Command Line), file conversions can be done consecutively or simultaneously. ...

EMF to XPS Converter Command Line Developer License

2.0 download

... integrated COM object (or DLL Library, or Command Line), enabling developers to access the converter via any ... the COM object (or DLL Library, or Command Line), file conversions can be done consecutively or simultaneously. ...

ConnectCode SparkCode Professional

2.0 download

... the flow and allows users to customize the charts with various options. The graphics in SparkCode are implemented as font glyphs, which means the charts (lines, columns, dots) are actually a string of ...

OpenOffice Calc Join Table Based On Common Column Software

7.0 download

... this join, rows from the two tables will line up perfectly without copying and pasting. Calc 2.0 or higher required. ...

LibreOffice for Mac

24.2.4 download

... then use it to present your final output. Charts and analysis tools help bring transparency to your ... 2D and 3D graphics from 13 categories, including line, area, bar, pie, X-Y, and net – with ...

SSuite QT Calc Express

2.4.2.1 download

... eight or more categories of 2-D and 3-D charts including line, area, column, pie, XY, stock and with dozens ... Calc lets you present spreadsheet data in dynamic charts that update automatically when the data changes. This ...