TraderCode Technical Indicators 5.0

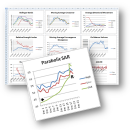
TraderCode is a library of technical analysis functions for used with Microsoft Excel. It allows you to create many types of technical indicators used in trading systems like Moving Averages, Directional Movements, Oscillators,Pivot Points, Donchian Channels and many more. With these indicators you can easily perform end-of-day analysis or back-testing of historical stock data. The software comes with both formulas for Excel and an add-in Wizard. ...

Author ConnectCode Pte Ltd
License Demo
Price $165.00
Released 2010-11-10
Downloads 991
Filesize 5.41 MB
Requirements Excel 2003, Excel 2007, Excel 2010
Installation Install and Uninstall
Keywords technical indicator, technical indicators, techical analysis, techical analysis indicators, stock trading
Users' rating
(25 rating)
TraderCode Technical IndicatorsInvestment ToolsWin2000, WinServer, Windows Vista, Windows Vista x64, Windows XP
TraderCode Technical Indicators stocks chart - Download Notice

Using TraderCode Technical Indicators Free Download crack, warez, password, serial numbers, torrent, keygen, registration codes, key generators is illegal and your business could subject you to lawsuits and leave your operating systems without patches. We do not host any torrent files or links of TraderCode Technical Indicators on rapidshare.com, depositfiles.com, megaupload.com etc. All TraderCode Technical Indicators download links are direct TraderCode Technical Indicators full download from publisher site or their selected mirrors.
Avoid: stocks chart oem software, old version, warez, serial, torrent, TraderCode Technical Indicators keygen, crack.
Consider: TraderCode Technical Indicators full version, stocks chart full download, premium download, licensed copy.

TraderCode Technical Indicators stocks chart - The Latest User Reviews

Most popular Investment Tools downloads

Stock Spy - RSS Stock News Charts

1.90 download

Have you ever seen a stock chart and wondered what made the stock shoot up ... rock? Stock Spy is unlike any other stock chart because it helps explain what you're seeing. It ...

Stock Predictor

1.1.361 download

Stock Predictor is an advanced stock charting and investment strategies backtesting software for financial market ... indicators for a single security on the same chart, maintains selected lists of stocks and indices and ...

Stock Predictor

1.1.361 download

Stock Predictor is an advanced stock charting and investment strategies backtesting software for financial market ... indicators for a single security on the same chart, maintains selected lists of stocks and indices and ...

Stock Spy Mac OS X- RSS Stock News Charts

1.90 download

Have you ever seen a stock chart and wondered what made the stock shoot up ... rock? Stock Spy is unlike any other stock chart because it helps explain what you're seeing. It ...

StockwareLive

2.1 download

... specifically for intraday traders. It displays intraday price charts side by side in full screen mode, that ... your choice and creates buy, sell signals on chart. The intraday trader can quickly view the price ...

WinTrend

3.9 download

Wintrend.com is providing high quality Real-time and Historical Charting and Technical Analysis for the financial markets. Supports all types of markets: stocks, futures, indexes, spreds, currencies and options. Wintrend has ... free Microsoft .net competitive compiles . Continuously updated charts as trades occur. Real-time tick by tick charting. ...

TraderStar

1.1.0.2 download

TraderStar is a Powerful professional analysis Software of a new Generation with significant advantages over similar programs. TraderStar is designed for a broad range of users, from stock exchange professionals to ...

VistaTrades

2.8.9 download

... to come up with a list of potential stocks, ETFs, or mutual funds to buy on any given day in the past, or today. This is called the Screener and ...

TraderCode Technical Indicators

5.0 download

... be carried out on different equity assets or stocks. Backtesting Expert The Backtesting Expert is a spreadsheet ... be measured and analyzed quickly and easily. Point-and-Figure Charting Expert Point-and-Figure charting is an analysis technique that ...

ChartNexus for Stock Markets

3.1.1 download

... successful trader or investor is a stock market charting software. We are lowering your operating cost as a trader and investor by offering you ChartNexus Charting (Stock Market Analysis) Software for FREE! Comes ...