Chart Patterns Tutorial 3.6

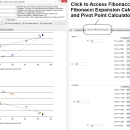
Chart Patterns Tutorial Application uses the computer simulation to visualize the chart patterns that are derived from Fractal Wave. This tool can visualize the Fibonacci Price Pattern, Harmonic Pattern, Elliott Wave and X3 Chart Pattern. It is a great tool to visualize the profitable chart patterns for the self-education. In addition, this tool provides Fibonacci Retracement calculator, Fibonacci Expansion calculator, and Pivot Point calculator. ...

Author Young Ho Seo
License Freeware
Price FREE
Released 2021-04-17
Downloads 208
Filesize 891 kB
Requirements Dot Net Framework 4.5 or higher on Windows
Installation Install and Uninstall
Keywords Chart Patterns, Fibonacci Analysis, Harmonic Pattern, Elliott Wave, X3 Chart Pattern, Pivot Point
Users' rating
(20 rating)
Chart Patterns TutorialInvestment ToolsWindows 7 x32, Windows 7 x64, WinOther, Other
Chart Patterns Tutorial uses - Download Notice

Using Chart Patterns Tutorial Free Download crack, warez, password, serial numbers, torrent, keygen, registration codes, key generators is illegal and your business could subject you to lawsuits and leave your operating systems without patches. We do not host any torrent files or links of Chart Patterns Tutorial on rapidshare.com, depositfiles.com, megaupload.com etc. All Chart Patterns Tutorial download links are direct Chart Patterns Tutorial full download from publisher site or their selected mirrors.
Avoid: uses oem software, old version, warez, serial, torrent, Chart Patterns Tutorial keygen, crack.
Consider: Chart Patterns Tutorial full version, uses full download, premium download, licensed copy.

Chart Patterns Tutorial uses - The Latest User Reviews

Most popular Investment Tools downloads

Stock Share Price Analysis

1 download

... to identify value buy sell trade points. It uses current Google Finance data for current share prices and actual earnings per share. From this data actual fair value share prices ...

TraderCode Technical Indicators

5.0 download

... among traders and investors. This technical analysis technique uses a chart with "X"s and "O"s for predicting financial asset prices. ...

Chart Patterns Tutorial

3.6 download

Chart Patterns Tutorial Application uses the computer simulation approach to visualize the chart patterns that are derived from Fractal Wave. This tool can visualize the Fibonacci Price Pattern, Harmonic Pattern, ...

VistaTrades

2.8.9 download

... the stock market. Its an overbought/oversold screener that uses the trademarked TriVista Indicator (TVI) and the TriVista ... index is in the Buy Zone (oversold). VistaTrades uses a screening method to come up with a ...

Option Trading Workbook

2.1 download

Free option pricing spreadsheet. Uses Black and Scholes to calculate the theoretical price and option greek derivatives of call and put options. Includes a strategy simulation worksheet, which enables a ...

Options Trading Tool

1.0 download

... stocks or futures one option trades. The program uses the Black-Scholes-Model. ...

Local Trade Copier

2.0 download

... master/slave accounts you have. The Local Trade Copier uses files to exchange trade list and information between master and slave account. You can have unlimited master accounts and unlimited slave ...