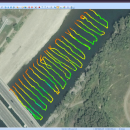
Eye4Software Hydromagic 7.0.15.929
... MIF/MID, AutoCad DXF files, IHO S57/S63 Electronic Natutical Charts and ESRI shapefiles. ...
| Author | Eye4Software B.V. |
| License | Demo |
| Price | $1549.93 |
| Released | 2015-10-09 |
| Downloads | 593 |
| Filesize | 83.02 MB |
| Requirements | Windows XP SP3 or higher |
| Installation | Install and Uninstall |
| Keywords | Hydrographic Survey Software, Hydrographic Software, Hydrographic Survey, Bathymetry, Seafloor Mapping Software, Hydrographic Data Acquisition, Dredging Volume Calculation, Volume Calculations, Bathymetric Software, Single Beam Data Collection |
| Users' rating (27 rating) |
Using Eye4Software Hydromagic Free Download crack, warez, password, serial numbers, torrent, keygen, registration codes,
key generators is illegal and your business could subject you to lawsuits and leave your operating systems without patches.
We do not host any torrent files or links of Eye4Software Hydromagic on rapidshare.com, depositfiles.com, megaupload.com etc.
All Eye4Software Hydromagic download links are direct Eye4Software Hydromagic full download from publisher site or their selected mirrors.
Avoid: chart oem software, old version, warez, serial, torrent, Eye4Software Hydromagic keygen, crack.
Consider: Eye4Software Hydromagic full version, chart full download, premium download, licensed copy.