OzGISMac 14.7-14.11.2020

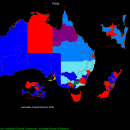
OzGISMac is an extensive system for the analysis and display of geographically referenced data. About 150 menus provide an enormous range of options The system can be used to analyze socio-economic and demographic data produced by censuses and surveys and to support management decisions associated with for example marketing, sales, site and personnel location, and advertising. Other spatial data such as environmental data can be displayed. ...

Author OzGIS
License Freeware
Price FREE
Released 2020-11-14
Downloads 117
Filesize 307 kB
Requirements Mac OS X, 64bit Windows, Ubuntu
Installation Install Only
Keywords mapping, census, territory, GIS
Users' rating
(3 rating)
OzGISMacMath & Scientific ToolsMac OS X,
OzGISMac diagrams - Download Notice

Using OzGISMac Free Download crack, warez, password, serial numbers, torrent, keygen, registration codes, key generators is illegal and your business could subject you to lawsuits and leave your operating systems without patches. We do not host any torrent files or links of OzGISMac on rapidshare.com, depositfiles.com, megaupload.com etc. All OzGISMac download links are direct OzGISMac full download from publisher site or their selected mirrors.
Avoid: diagrams oem software, old version, warez, serial, torrent, OzGISMac keygen, crack.
Consider: OzGISMac full version, diagrams full download, premium download, licensed copy.

OzGISMac diagrams - The Latest User Reviews

Most popular Math & Scientific Tools downloads

yEd Graph Editor for Mac and Linux

3.23.2 download

... be used to quickly and effectively generate high-quality diagrams. Create diagrams manually, or import your external data for analysis. ... elements to get you started with your first diagrams, including: a wide variety of shape nodes ...

Cross Section Analysis and Design

5.6.8 download

... sectional properties, plot Moment – Curvature and Interaction diagrams, estimate the location of neutral axis under given ... loads and plot the corresponding stress – strain diagrams as well as the resulting stress contours. The ...

yEd Graph Editor

3.23.2 download

... be used to quickly and effectively generate high-quality diagrams. Create diagrams manually, or import your external data for analysis. ... elements to get you started with your first diagrams, including: a wide variety of shape nodes ...

yEd Graph Editor 64-bit

3.23.2 download

... be used to quickly and effectively generate high-quality diagrams. Create diagrams manually, or import your external data for analysis. ... elements to get you started with your first diagrams, including: a wide variety of shape nodes ...

OzGIS

14.7.0.7 download

... data as several different types of maps and diagrams. . facilities to analyse displayed data and to manipulate the maps. . Special support for site catchment analysis, location / allocation ...

Cross Section Analysis and Design

5.6.8 download

... sectional properties, plot Moment – Curvature and Interaction diagrams, estimate the location of neutral axis under given ... loads and plot the corresponding stress – strain diagrams as well as the resulting stress contours. The ...

SimApp

2.7 download

... special and drawing.). Illustration and documentation of the diagrams with shapes (lines, rectangles, circles, etc.) and text. ... as well as time, Bode, Nichols-Black and Nyquist diagrams which can exported to other applications for further ...

OzGISMac

14.7-14.11.2020 download

... data as several different types of maps and diagrams. . facilities to analyse displayed data and to manipulate the maps. . Special support for site catchment analysis, location / allocation ...

EngiLab Truss.2D 2022

1.1 download

... the Model Deformation, Free Body Diagram, Axial Force/Stress/Strain Diagrams and Color Plots, where each member is colored according to the value of its Force, Stress or Strain. Red color is ...

EngiLab Frame.2D 2021

3.5 download

... Body Diagram, Axial, Shear Force and Bending Moment Diagrams. Although the FEM analysis provides results only at ... for all quantities, so that all drawings and diagrams are continuous and 100% accurate. The user can ...