Powerstaxx Non Linear 1.2.0

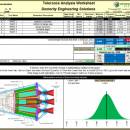
Powerstaxx Non-Linear tolerance analysis software is an Excel based, associative tolerance analysis tool that makes it easy to be thorough. Being associative, all dimensions are managed on one sheet and then used to populate up to 200 worst case, RSS, modified stack ups or non-linear. This allows one spreadsheet to easily manage situations where dimensions are used in multiple stack ups. Powerstaxx helps manage the risk in your project and is th ...

Author Dexterity Engineering Solutions
License Free To Try
Price $449.00
Released 2014-08-25
Downloads 283
Filesize 8.43 MB
Requirements Excel 2007 or later
Installation Install and Uninstall
Keywords tolerance analysis, Excel, root sum squares, RSS, non-linear, modified RSS, modified root sum squares
Users' rating
(7 rating)
Powerstaxx Non LinearMath & Scientific ToolsWindows 7 x32, Windows 7 x64, Windows 8, Windows Vista, Windows Vista x64
Powerstaxx Non Linear graph - Download Notice

Using Powerstaxx Non Linear Free Download crack, warez, password, serial numbers, torrent, keygen, registration codes, key generators is illegal and your business could subject you to lawsuits and leave your operating systems without patches. We do not host any torrent files or links of Powerstaxx Non Linear on rapidshare.com, depositfiles.com, megaupload.com etc. All Powerstaxx Non Linear download links are direct Powerstaxx Non Linear full download from publisher site or their selected mirrors.
Avoid: graph oem software, old version, warez, serial, torrent, Powerstaxx Non Linear keygen, crack.
Consider: Powerstaxx Non Linear full version, graph full download, premium download, licensed copy.

Powerstaxx Non Linear graph - The Latest User Reviews

Most popular Math & Scientific Tools downloads

yEd Graph Editor for Mac and Linux

3.24 download

... easily import your own bitmaps (JPG, PNG), vector graphics (SVG), or shape stencils from Visio® VSX files into the palette to create custom element types. Clearly Displayed Data ...

yEd Graph Editor 64-bit

3.24 download

... easily import your own bitmaps (JPG, PNG), vector graphics (SVG), or shape stencils from Visio® VSX files into the palette to create custom element types. Clearly Displayed Data ...

Powerstaxx Plus

2.4.0 download

... With each stack up is a bell curve graph showing predicted results and space to place an image of what is being evaluated. The Plus version of Powerstaxx calculates PPM ...

DigitizeIt for Mac

2.5.9 download

DigitizeIt digitizes scanned graphs and charts. Graphs can be loaded in nearly all common image ... defined and edited. Can handle tilted and distorted graphs. Includes comprehensive online help. ...

MITCalc Profiles Calculation

1.20 download

... area characteristics of profiles created in a simple graphic editor and mass characteristics of solids created by ... - Creation of a profile in a simple graphic editor. - Calculation of area characteristics (Ix, Sx) ...

statistiXL

2.0 download

... familiar with to arrange and format textual and graphical output even further, changing fonts, rearranging cells, altering the scale on the axis of a graph etc etc. You can even subject the results ...

WINKS, Windows KWIKSTAT

7.06 download

... Excel-like data handling. Reads Excel data, creates Excel graphs. Award-winning statistics program with thousands of users in ... analyses available in WINKS include Descriptive statistics and graphs, calculation of p-values, T-tests and Analysis of Variance ...

Grab It

XP download

... Excel based application that digitizes data from pictures. Graphs and charts can have data point values digitized ... and distance measurements made on scanned photos. Skewed graphs are handled automatically (sometimes scanning isn't perfectly straight) ...

Powerstaxx Non Linear

1.2.0 download

... With each stack up is a bell curve graph showing predicted results and space to place an image of what is being evaluated. The Plus version of Powerstaxx calculates PPM ...

Develve

3.50 download

... to improve the productivity. For instance the result graphs are easily scrollable and with a click on a graph a bigger version will pop up. Develve clearly ...